第三方库导入和数据集的导入,数据集的查看 第三方库的导入和输出对应的版本编号 1 2 3 4 5 6 7 8 9 10 11 12 13 14 15 16 17 18 19 20 21 22 23 24 25 import pandas as pdimport osimport matplotlib.pyplot as pltimport seaborn as snsimport numpy as npfrom sklearn.model_selection import train_test_split, cross_val_scorefrom sklearn.metrics import mean_squared_errorfrom catboost import CatBoostRegressorfrom IPython.core.display import HTMLdef show_object_columns_info (df ): "显示DataFrame中所有object类型列的信息,包括列名、唯一值数量和所有唯一值" object_cols = df.select_dtypes(include=['object' ]).columns print (object_cols) for col in object_cols: print (f"列名: {col} " ) print (f'object数量: {df[col].nunique()} ' ) print (df[col].unique()) print (sns.__version__)print (pd.__version__)print (np.__version__)
0.13.2
2.3.3
1.26.4
数据的导入,数据集的描述和清洗 1 2 3 4 5 6 7 8 9 10 11 train_path = "../../datasets/competition_datas/Accident_Risk/train.csv" test_path = "../../datasets/competition_datas/Accident_Risk/test.csv" train_ds = pd.read_csv(train_path) train_ds.head()
id
road_type
num_lanes
curvature
speed_limit
lighting
weather
road_signs_present
public_road
time_of_day
holiday
school_season
num_reported_accidents
accident_risk
0
0
urban
2
0.06
35
daylight
rainy
False
True
afternoon
False
True
1
0.13
1
1
urban
4
0.99
35
daylight
clear
True
False
evening
True
True
0
0.35
2
2
rural
4
0.63
70
dim
clear
False
True
morning
True
False
2
0.30
3
3
highway
4
0.07
35
dim
rainy
True
True
morning
False
False
1
0.21
4
4
rural
1
0.58
60
daylight
foggy
False
False
evening
True
False
1
0.56
1 2 3 test_ds = pd.read_csv(test_path) test_ds.head()
id
road_type
num_lanes
curvature
speed_limit
lighting
weather
road_signs_present
public_road
time_of_day
holiday
school_season
num_reported_accidents
0
517754
highway
2
0.34
45
night
clear
True
True
afternoon
True
True
1
1
517755
urban
3
0.04
45
dim
foggy
True
False
afternoon
True
False
0
2
517756
urban
2
0.59
35
dim
clear
True
False
afternoon
True
True
1
3
517757
rural
4
0.95
35
daylight
rainy
False
False
afternoon
False
False
2
4
517758
highway
2
0.86
35
daylight
clear
True
False
evening
False
True
3
数据的可视化(了解数据,并不是选择特征) 由于上述数据并没有缺失值,因此我们不用处理缺失值.直接使用可视化工具进行可视化分析.
1 2 3 4 5 6 y = train_ds['accident_risk' ] X = train_ds.drop(columns=['accident_risk' , 'id' ],axis=1 ) X.info() display(X.head()) X_num = X.select_dtypes(include=['int64' , 'float64' ])
<class 'pandas.core.frame.DataFrame'>
RangeIndex: 517754 entries, 0 to 517753
Data columns (total 12 columns):
# Column Non-Null Count Dtype
--- ------ -------------- -----
0 road_type 517754 non-null object
1 num_lanes 517754 non-null int64
2 curvature 517754 non-null float64
3 speed_limit 517754 non-null int64
4 lighting 517754 non-null object
5 weather 517754 non-null object
6 road_signs_present 517754 non-null bool
7 public_road 517754 non-null bool
8 time_of_day 517754 non-null object
9 holiday 517754 non-null bool
10 school_season 517754 non-null bool
11 num_reported_accidents 517754 non-null int64
dtypes: bool(4), float64(1), int64(3), object(4)
memory usage: 33.6+ MB
road_type
num_lanes
curvature
speed_limit
lighting
weather
road_signs_present
public_road
time_of_day
holiday
school_season
num_reported_accidents
0
urban
2
0.06
35
daylight
rainy
False
True
afternoon
False
True
1
1
urban
4
0.99
35
daylight
clear
True
False
evening
True
True
0
2
rural
4
0.63
70
dim
clear
False
True
morning
True
False
2
3
highway
4
0.07
35
dim
rainy
True
True
morning
False
False
1
4
rural
1
0.58
60
daylight
foggy
False
False
evening
True
False
1
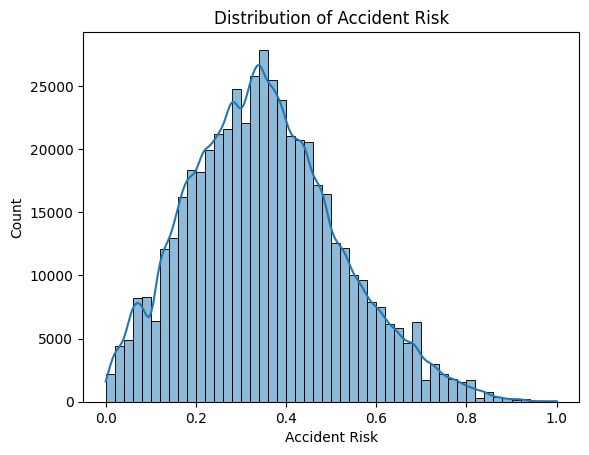
目标分布 1 2 3 4 5 plt.figure() sns.histplot(y, kde=True , bins=50 ) plt.title('Distribution of Accident Risk' ) plt.xlabel('Accident Risk' ) plt.show()
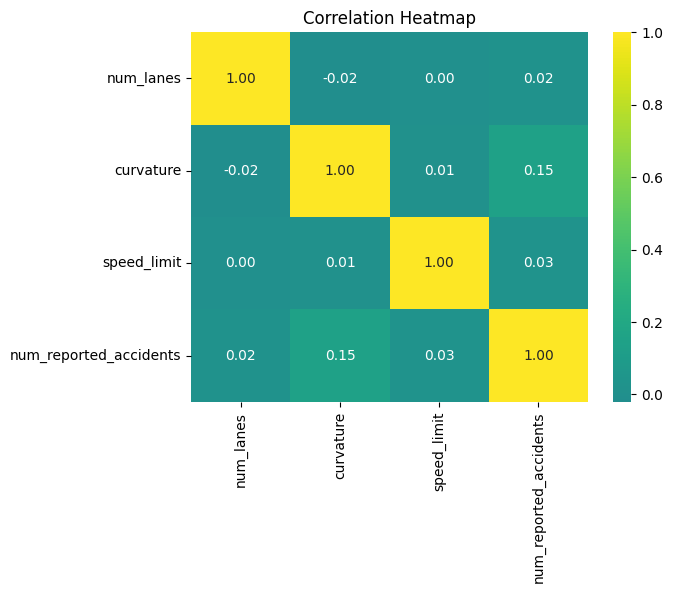
1 2 3 4 5 X_corr = X_num.corr() plt.figure() sns.heatmap(X_corr, annot=True , cmap='viridis' , center=0 , fmt='.2f' ) plt.title('Correlation Heatmap' ) plt.show()
catboost 1 2 3 4 5 6 7 8 9 10 11 12 13 14 15 16 X_bool_cols = X.select_dtypes(include=['bool' ]).columns print (X_bool_cols)for col in X_bool_cols: X[col] = X[col].astype(str ) test_ds[col] = test_ds[col].astype(str ) cat_features = X.select_dtypes(include=['object' ]).columns.tolist() print (cat_features)
Index(['road_signs_present', 'public_road', 'holiday', 'school_season'], dtype='object')
['road_type', 'lighting', 'weather', 'road_signs_present', 'public_road', 'time_of_day', 'holiday', 'school_season']
1 2 3 4 5 X_train, X_val, y_train, y_val = train_test_split(X, y, test_size=0.2 , random_state=42 , shuffle=True , stratify=y) print (X_train.shape, X_val.shape, y_train.shape, y_val.shape)
(414203, 12) (103551, 12) (414203,) (103551,)
1 2 3 4 5 6 7 8 9 10 11 12 13 14 15 16 params = { 'iterations' : 1000 , 'learning_rate' : 0.1 , 'depth' : 6 , 'cat_features' : cat_features, 'random_seed' : 42 , 'loss_function' : 'RMSE' , 'verbose' : 100 , 'early_stopping_rounds' : 50 , "task_type" : "GPU" , "devices" : "0" } Catboost_model = CatBoostRegressor(**params) Catboost_model.fit(X, y, eval_set=(X_val, y_val))
0: learn: 0.1523865 test: 0.1523846 best: 0.1523846 (0) total: 94.3ms remaining: 1m 34s
100: learn: 0.0564065 test: 0.0564811 best: 0.0564811 (100) total: 8.16s remaining: 1m 12s
200: learn: 0.0561983 test: 0.0563075 best: 0.0563075 (200) total: 17s remaining: 1m 7s
300: learn: 0.0560877 test: 0.0562139 best: 0.0562139 (300) total: 26s remaining: 1m
400: learn: 0.0560011 test: 0.0561416 best: 0.0561416 (400) total: 34.5s remaining: 51.5s
500: learn: 0.0559323 test: 0.0560808 best: 0.0560808 (500) total: 43.1s remaining: 42.9s
600: learn: 0.0558682 test: 0.0560278 best: 0.0560278 (600) total: 52.6s remaining: 34.9s
700: learn: 0.0558153 test: 0.0559829 best: 0.0559829 (700) total: 1m 1s remaining: 26.2s
800: learn: 0.0557594 test: 0.0559401 best: 0.0559401 (800) total: 1m 10s remaining: 17.4s
900: learn: 0.0557073 test: 0.0559001 best: 0.0559001 (899) total: 1m 19s remaining: 8.72s
999: learn: 0.0556659 test: 0.0558659 best: 0.0558659 (999) total: 1m 29s remaining: 0us
bestTest = 0.05586587195
bestIteration = 999
<catboost.core.CatBoostRegressor at 0x257b5932e50>
1 2 3 4 5 6 7 8 9 10 11 12 y_pred = Catboost_model.predict(X_val) val_rmse = mean_squared_error(y_val, y_pred) print (f"Validation RMSE: {val_rmse:.4 f} " )cv_scores = cross_val_score(Catboost_model, X, y, cv=5 , scoring='neg_mean_squared_error' ) cv_rmse = np.sqrt(-cv_scores) print (f"Cross-validation RMSE: {cv_rmse.mean():.4 f} (+/- {cv_rmse.std() * 2 :.4 f} )" )
Validation RMSE: 0.0031
0: learn: 0.1523602 total: 74.6ms remaining: 1m 14s
100: learn: 0.0563163 total: 7.29s remaining: 1m 4s
200: learn: 0.0560969 total: 14.1s remaining: 56.1s
300: learn: 0.0559734 total: 20.9s remaining: 48.6s
400: learn: 0.0558743 total: 29.3s remaining: 43.8s
500: learn: 0.0557934 total: 36.8s remaining: 36.7s
600: learn: 0.0557296 total: 45.4s remaining: 30.1s
700: learn: 0.0556612 total: 53s remaining: 22.6s
800: learn: 0.0556026 total: 1m remaining: 15s
900: learn: 0.0555548 total: 1m 10s remaining: 7.79s
999: learn: 0.0555088 total: 1m 32s remaining: 0us
0: learn: 0.1524152 total: 78.6ms remaining: 1m 18s
100: learn: 0.0564793 total: 10.3s remaining: 1m 31s
200: learn: 0.0562581 total: 21.2s remaining: 1m 24s
300: learn: 0.0561289 total: 33.6s remaining: 1m 17s
400: learn: 0.0560335 total: 44s remaining: 1m 5s
500: learn: 0.0559565 total: 57.6s remaining: 57.3s
600: learn: 0.0558867 total: 1m 13s remaining: 48.6s
700: learn: 0.0558220 total: 1m 26s remaining: 36.9s
800: learn: 0.0557681 total: 1m 38s remaining: 24.5s
900: learn: 0.0557146 total: 1m 50s remaining: 12.2s
999: learn: 0.0556690 total: 2m 4s remaining: 0us
0: learn: 0.1523094 total: 71.2ms remaining: 1m 11s
100: learn: 0.0563526 total: 11.3s remaining: 1m 40s
200: learn: 0.0561467 total: 23.4s remaining: 1m 33s
300: learn: 0.0560148 total: 35.4s remaining: 1m 22s
400: learn: 0.0559182 total: 49.6s remaining: 1m 14s
500: learn: 0.0558331 total: 1m 2s remaining: 1m 2s
600: learn: 0.0557582 total: 1m 16s remaining: 50.5s
700: learn: 0.0556941 total: 1m 28s remaining: 37.7s
800: learn: 0.0556372 total: 1m 39s remaining: 24.8s
900: learn: 0.0555797 total: 1m 50s remaining: 12.2s
999: learn: 0.0555314 total: 2m 1s remaining: 0us
0: learn: 0.1524123 total: 80ms remaining: 1m 19s
100: learn: 0.0563271 total: 8.31s remaining: 1m 13s
200: learn: 0.0561321 total: 19.8s remaining: 1m 18s
300: learn: 0.0560138 total: 35.6s remaining: 1m 22s
400: learn: 0.0559252 total: 48.3s remaining: 1m 12s
500: learn: 0.0558532 total: 59.8s remaining: 59.6s
600: learn: 0.0557891 total: 1m 11s remaining: 47.2s
700: learn: 0.0557296 total: 1m 23s remaining: 35.5s
800: learn: 0.0556794 total: 1m 35s remaining: 23.7s
900: learn: 0.0556325 total: 1m 45s remaining: 11.6s
999: learn: 0.0555885 total: 1m 55s remaining: 0us
0: learn: 0.1523530 total: 80.1ms remaining: 1m 19s
100: learn: 0.0564252 total: 10.3s remaining: 1m 31s
200: learn: 0.0562220 total: 22.4s remaining: 1m 29s
300: learn: 0.0561025 total: 31.7s remaining: 1m 13s
400: learn: 0.0559980 total: 41.2s remaining: 1m 1s
500: learn: 0.0559200 total: 51.8s remaining: 51.6s
600: learn: 0.0558540 total: 1m 1s remaining: 40.9s
700: learn: 0.0557899 total: 1m 14s remaining: 31.9s
800: learn: 0.0557331 total: 1m 25s remaining: 21.2s
900: learn: 0.0556776 total: 1m 39s remaining: 11s
999: learn: 0.0556246 total: 1m 52s remaining: 0us
Cross-validation RMSE: 0.0561 (+/- 0.0005)
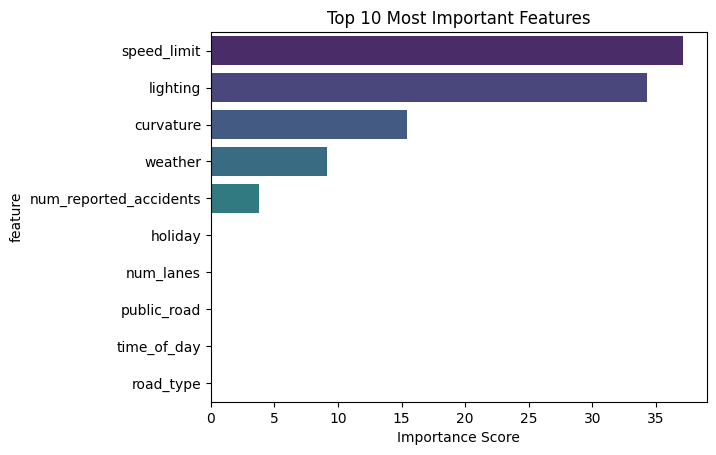
1 2 3 4 5 6 7 8 9 10 11 12 feature_importance = Catboost_model.get_feature_importance() feature_names = X.columns importance_df = pd.DataFrame({ 'feature' : feature_names, 'importance' : feature_importance }).sort_values('importance' , ascending=False ) print ("\nTop 10 Most Important Features:" )print (importance_df.head(10 ))
[2.68670072e-02 5.57111260e-02 1.53970212e+01 3.71319477e+01
3.42504222e+01 9.16493355e+00 2.00611428e-02 4.68708926e-02
2.95851141e-02 5.71107703e-02 1.50494424e-02 3.80441977e+00]
Index(['road_type', 'num_lanes', 'curvature', 'speed_limit', 'lighting',
'weather', 'road_signs_present', 'public_road', 'time_of_day',
'holiday', 'school_season', 'num_reported_accidents'],
dtype='object')
Top 10 Most Important Features:
feature importance
3 speed_limit 37.131948
4 lighting 34.250422
2 curvature 15.397021
5 weather 9.164934
11 num_reported_accidents 3.804420
9 holiday 0.057111
1 num_lanes 0.055711
7 public_road 0.046871
8 time_of_day 0.029585
0 road_type 0.026867
结果可视化 C:\Windows\Temp\ipykernel_27588\3889204982.py:3: FutureWarning:
Passing `palette` without assigning `hue` is deprecated and will be removed in v0.14.0. Assign the `y` variable to `hue` and set `legend=False` for the same effect.
sns.barplot(data=importance_df.head(10), x='importance', y='feature', palette='viridis')
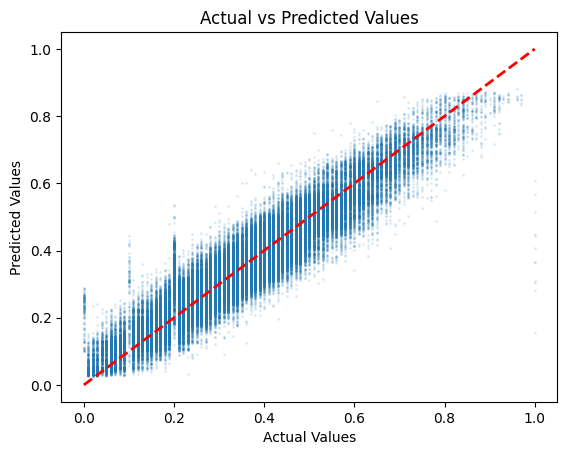
1 2 3 4 5 6 7 plt.scatter(y_val, y_pred, alpha=0.1 , marker='.' , s=5 ) plt.plot([y_val.min (), y_val.max ()], [y_val.min (), y_val.max ()], 'r--' , lw=2 ) plt.xlabel('Actual Values' ) plt.ylabel('Predicted Values' ) plt.title('Actual vs Predicted Values' ) plt.show()
提交结果 1 2 3 4 5 6 7 8 9 10 11 12 13 14 15 16 17 18 19 20 test_features = test_ds.drop('id' , axis=1 ) test_predictions = Catboost_model.predict(test_features) submission = pd.DataFrame({ 'id' : test_ds['id' ], 'accident_risk' : test_predictions }) submission.to_csv('submission.csv' , index=False ) print (f"Submission shape: {submission.shape} " )print ("\nFirst 5 rows of submission:" )display(submission.head())
Submission shape: (172585, 2)

First 5 rows of submission:
id
accident_risk
0
517754
0.291503
1
517755
0.122281
2
517756
0.187375
3
517757
0.313193
4
517758
0.398013